Can we determine what sediment sources fed a basin if all we have are the basin samples?
Summary
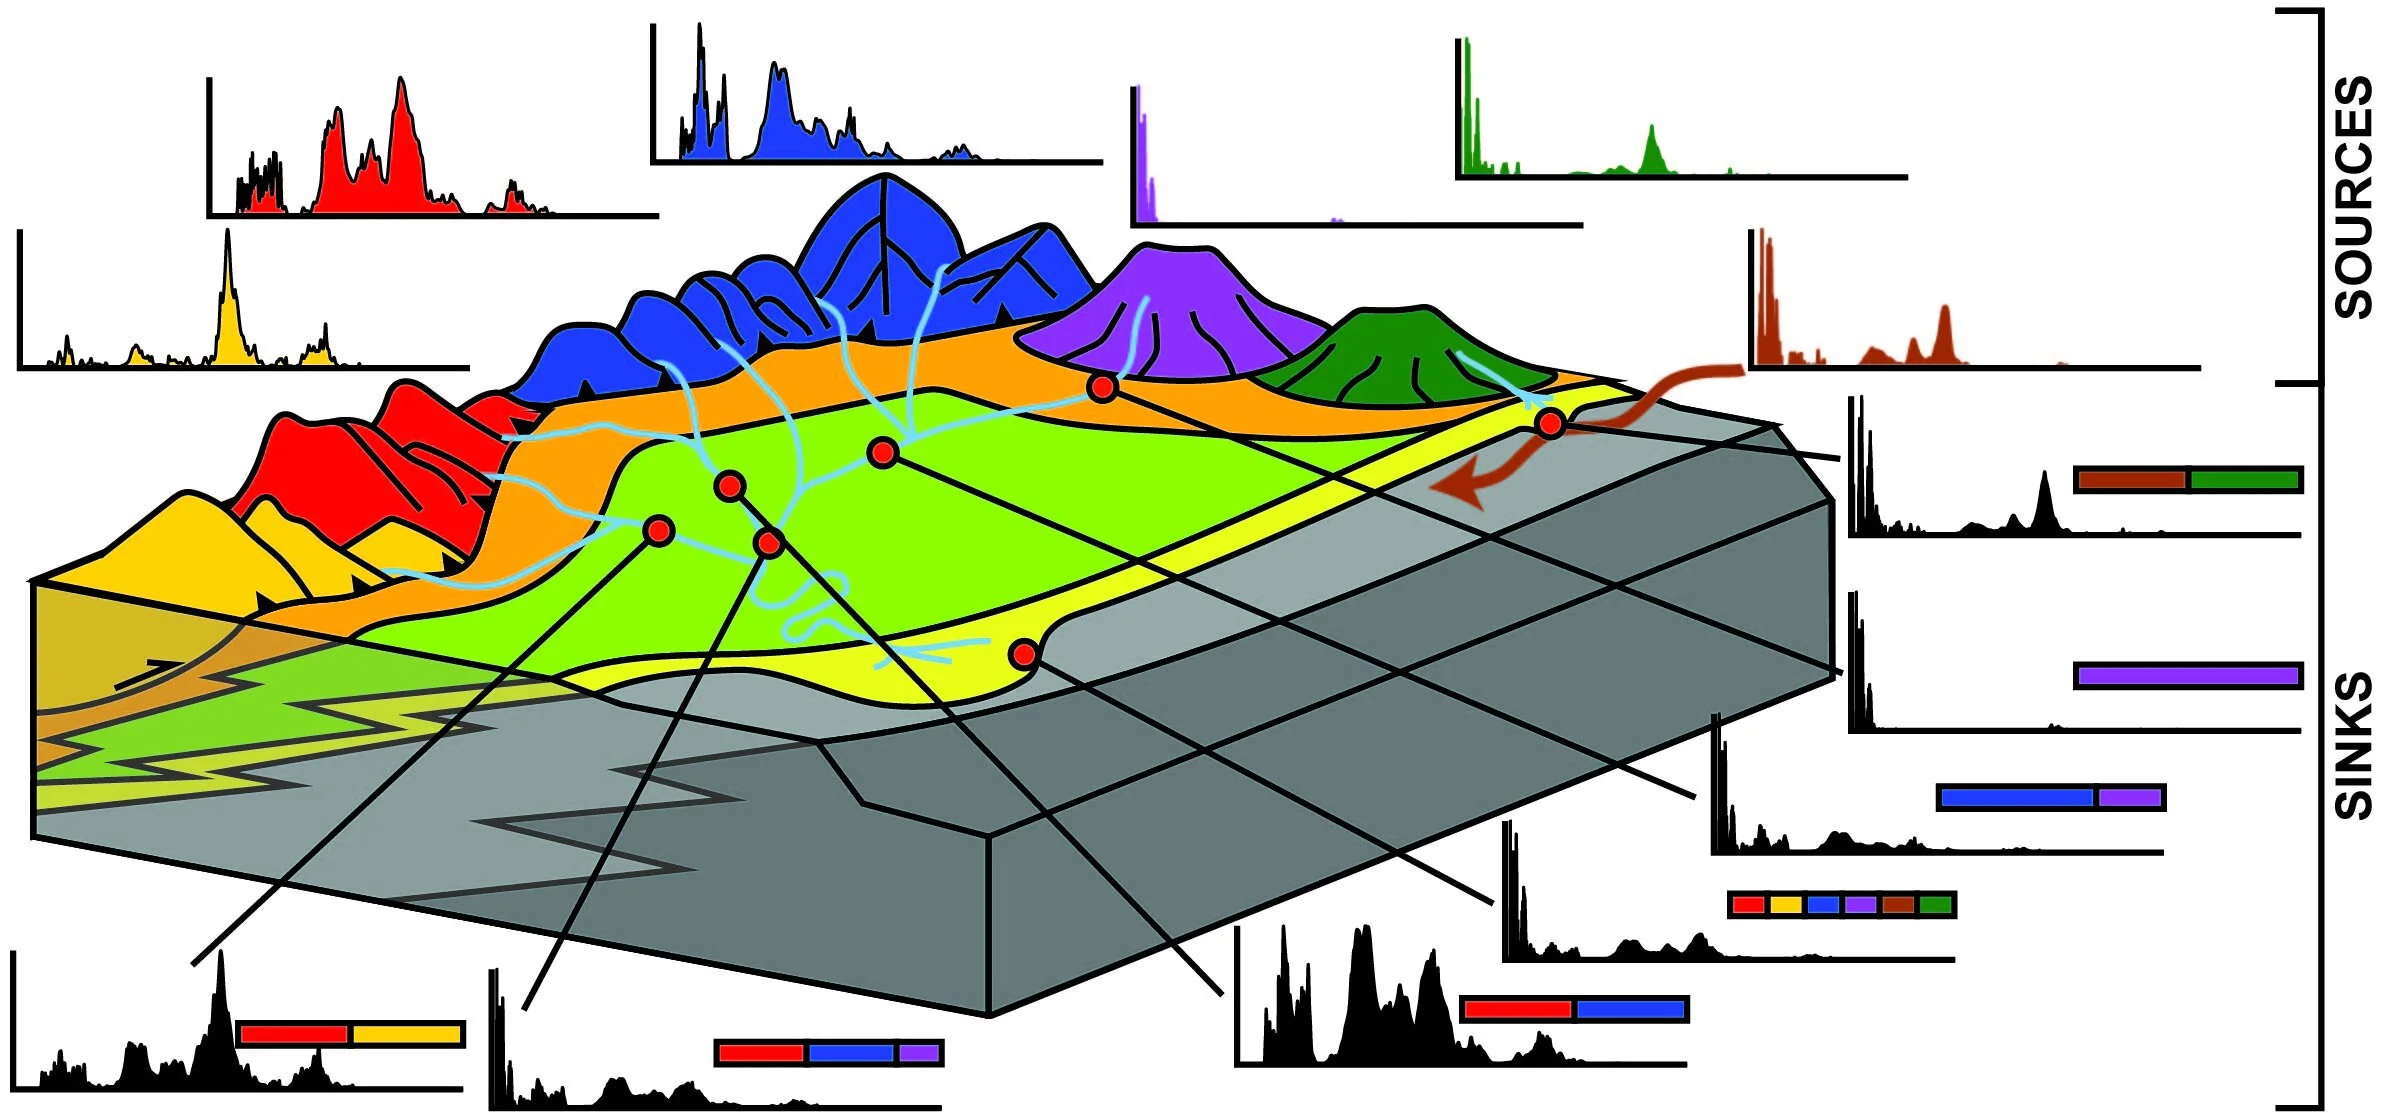
Approach: Non-negative Matrix Factorization
We adopted an approach using non-negative matrix factorization (NMF) of detrital zircon U-Pb age spectra to recover the common source age spectra and relative contributions to sink samples.
NMF was first tested on a synthetic data set comprised of 40 sink samples made of random mixtures of 10 sources. It was then applied to a data set of 24 samples from Late Cretaceous strata exposed in the Book Cliffs of Utah and documented by Bartschi et al. (2018).
Test: Source recovery
Factorization of 40 samples mixed from 10 sources confirmed that we can fully recover the U-Pb age distribution of the sources. We were also able to determine the proportions of each source which contributed to the sink samples.
Application: Book Cliffs, Utah
Factorization of the 24 samples from the Book Cliffs resulted in identification of 5 sources. Sources have U-Pb distributions comparable with known potential sources. Upsection changes in the proportions of sediment sources track tectonic activity in western North America in the Late Cretaceous.
Implications: elucidation of unknown sources
Synthetic data demonstrates that NMF is able to recover the characteristics of source U-Pb spectra based on sink age spectra. The algorithm can also identify the optimum number of sources. Application to the Book Cliffs confirms that factorization yields realistic source spectra, and that changes in source contributions correspond to tectonic events.
NMF presents a unique possibility of characterizing sediment sources even in the absence of direct access to samples of the sediment sources. Its ability to reconstruct sources that are otherwise lost to geologic processes makes it an invaluable tool for tectonic, geomorphic, sedimentological, and stratigraphic research.
The software used in this research is accessible at: github.com/kurtsundell/DZnmf
Read on for full details
Testing the method
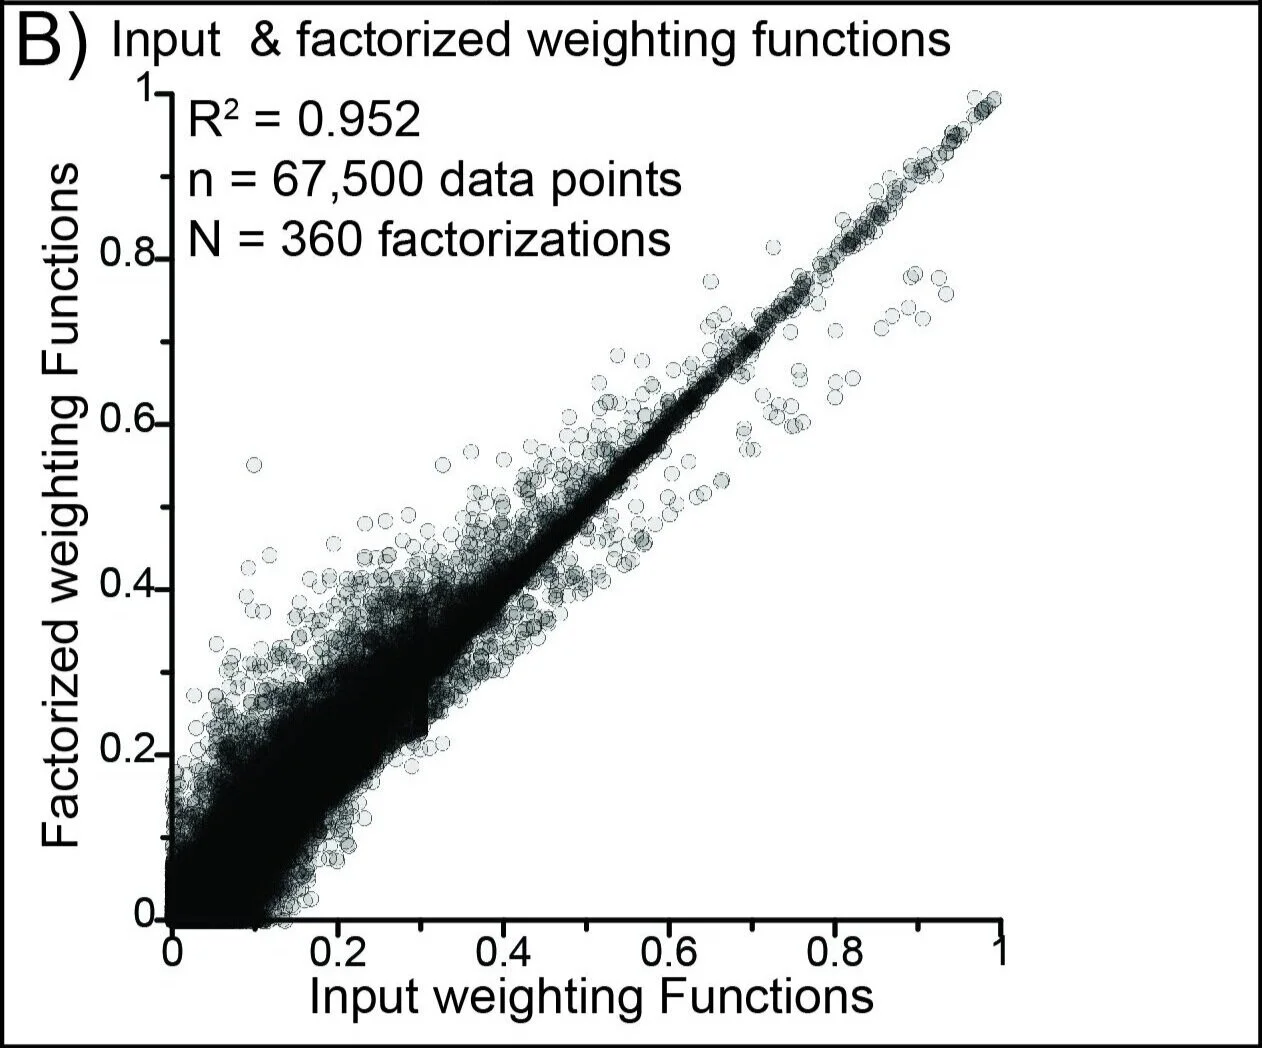
We tested the algorithm by comparing 10 numerically generated U-Pb data sets with 10 data sets produced by factorization. In this trial we mixed the 10 known “source data sets” in random proportions to produce 40 “sink samples”. We then factorized the 40 sink data sets and were able to recover the initial 10 sources. Comparison of the original (filled) and factorized (white, mirrored) age distributions shows a close correlation. The close correlation between the input and factorized data sets is further quantified using the Kuiper V statistic and cross-correlation coefficient, where identical sample pairs yield values of 0 and 1, respectively.
2. How many sources?
We apply a segmented linear regression approach to determine the optimum number of sources (the NMF rank) for factorization. Because NMF is intended to provide a low-rank approximation of the input data sets, our criterion is that the optimal number of source samples is the rank above which there is little or no decrease in final residual. This approach is similar to “scree” plots used to determine the number of dimensions for multi-dimensional scaling (Borg and Groenen, 1997; Hair et al., 1998; Steyvers, 2006)
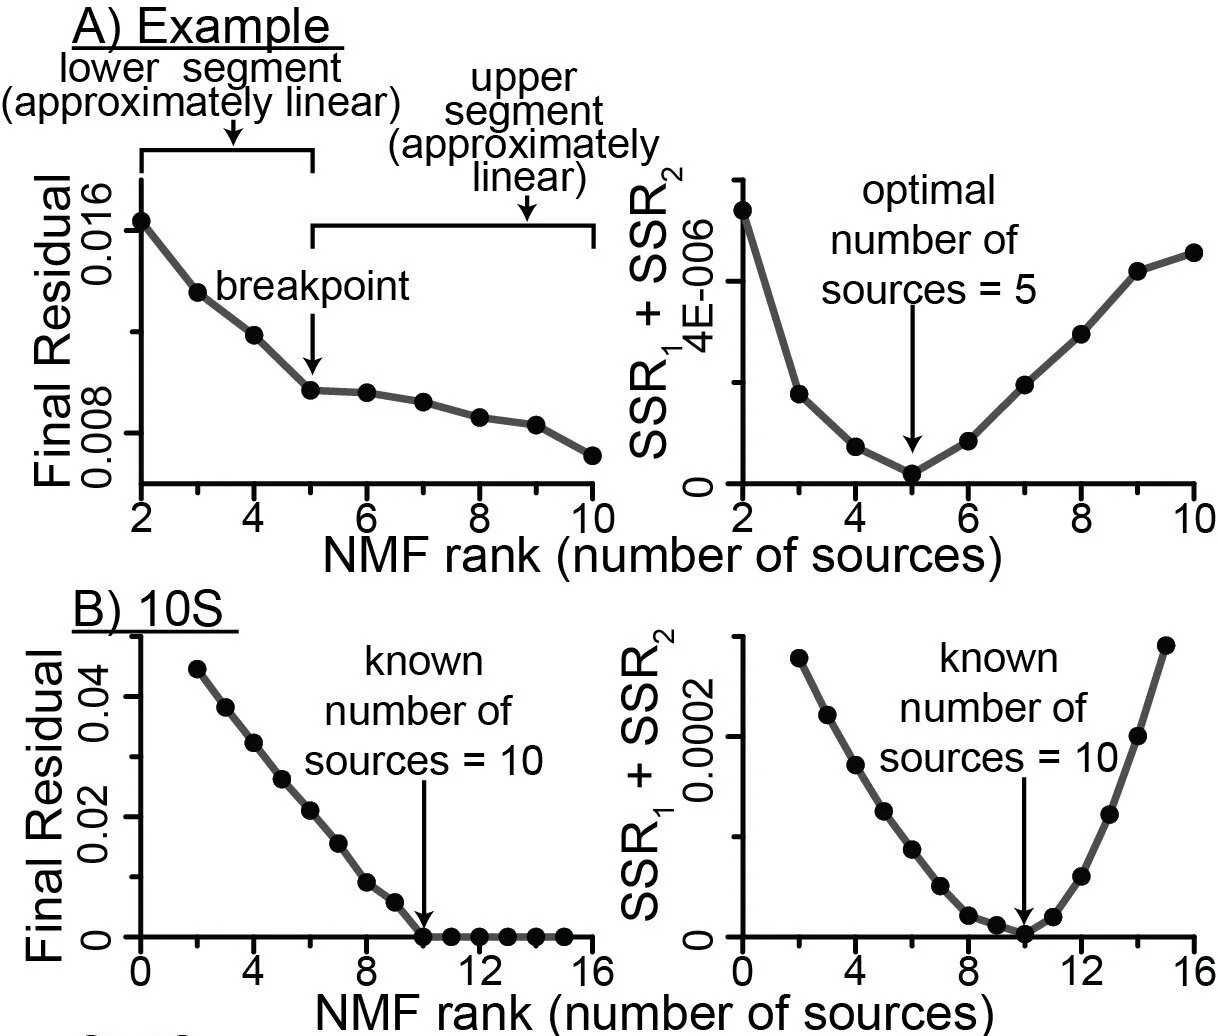
In order to identify the optimum breakpoint we plotted the final residual versus the rank and ap-plied a segmented linear regression with one break. We assumed that the optimal breakpoint, and therefore the optimal number of sources, will be the point which optimizes the linear fit of both the higher and lower rank segments, and calculated the sum of squared residuals (Draper and Smith, 1998) for each segment.
3. Book Cliffs
Geologic map of the Book Cliffs region in central Utah. The data used in this study come from Ferron, Rilda, Price, Tuscher, and Thompson canyons.
Segmented linear regression of the final residuals indicates that the optimum number of sources is five.
Factorization of the Book Cliffs data set to 5 sources confirms two things:
1) It confirms the previous conclusion that the composite data set of Paleozoic strata from the Canadian Passive Margin (A) did not contribute significantly to the basin fill. Of the six potential sources considered by Bartschi et al. (2018), the Canadian Passive margin was the one that is not matched by any of the factorized sources.
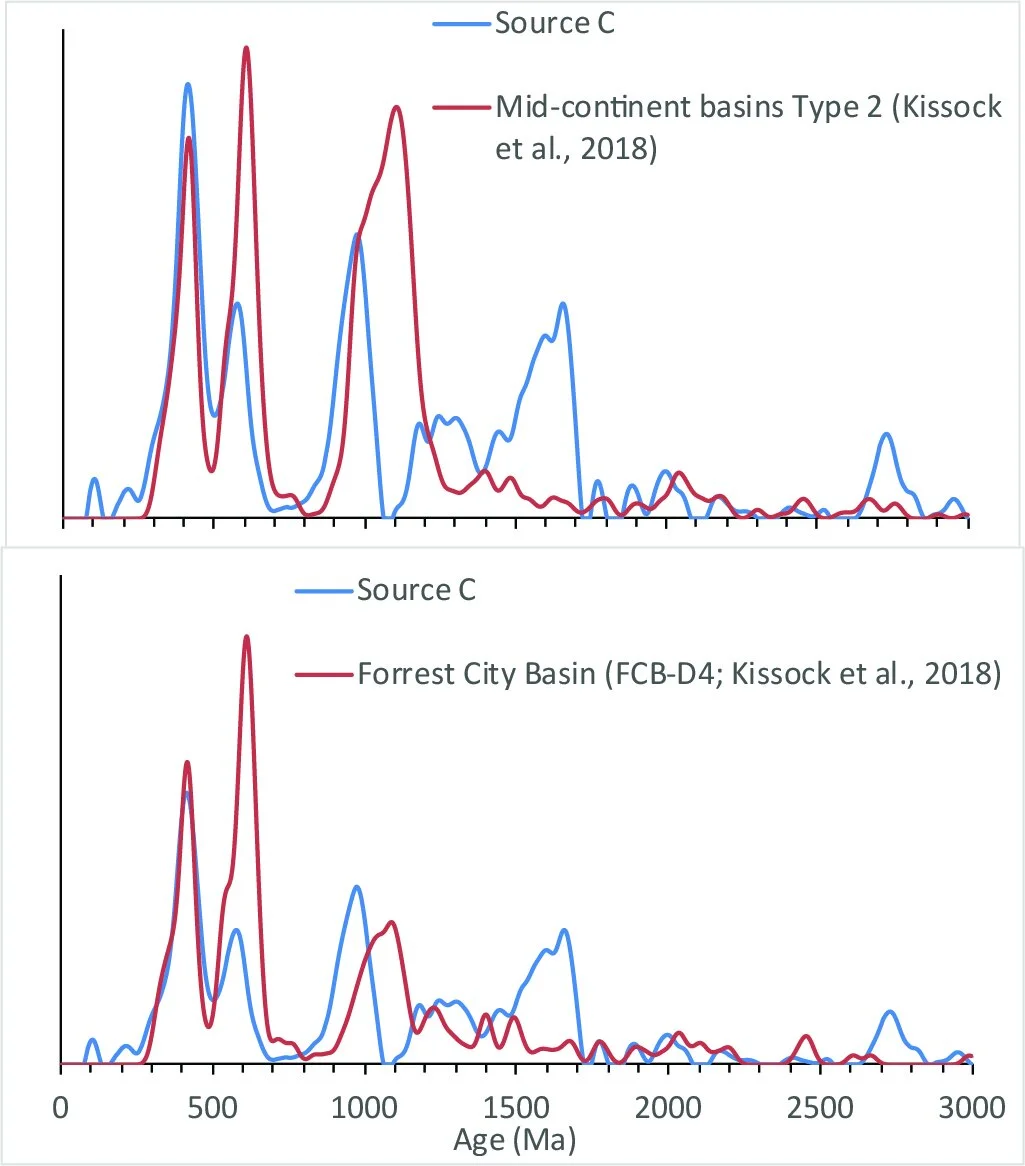
2) The other five factorized sources are well matched by known potential sources. Cross-correlation coefficients between 0.67 and 0.91 indicate close matches for all factorized sources. The exception to this is (C), for which the closest match is Mesozoic strata of the Sevier thrust belt. The poorness of this match (cross-correlation = 0.21) suggests that an alternative source may be indicated.
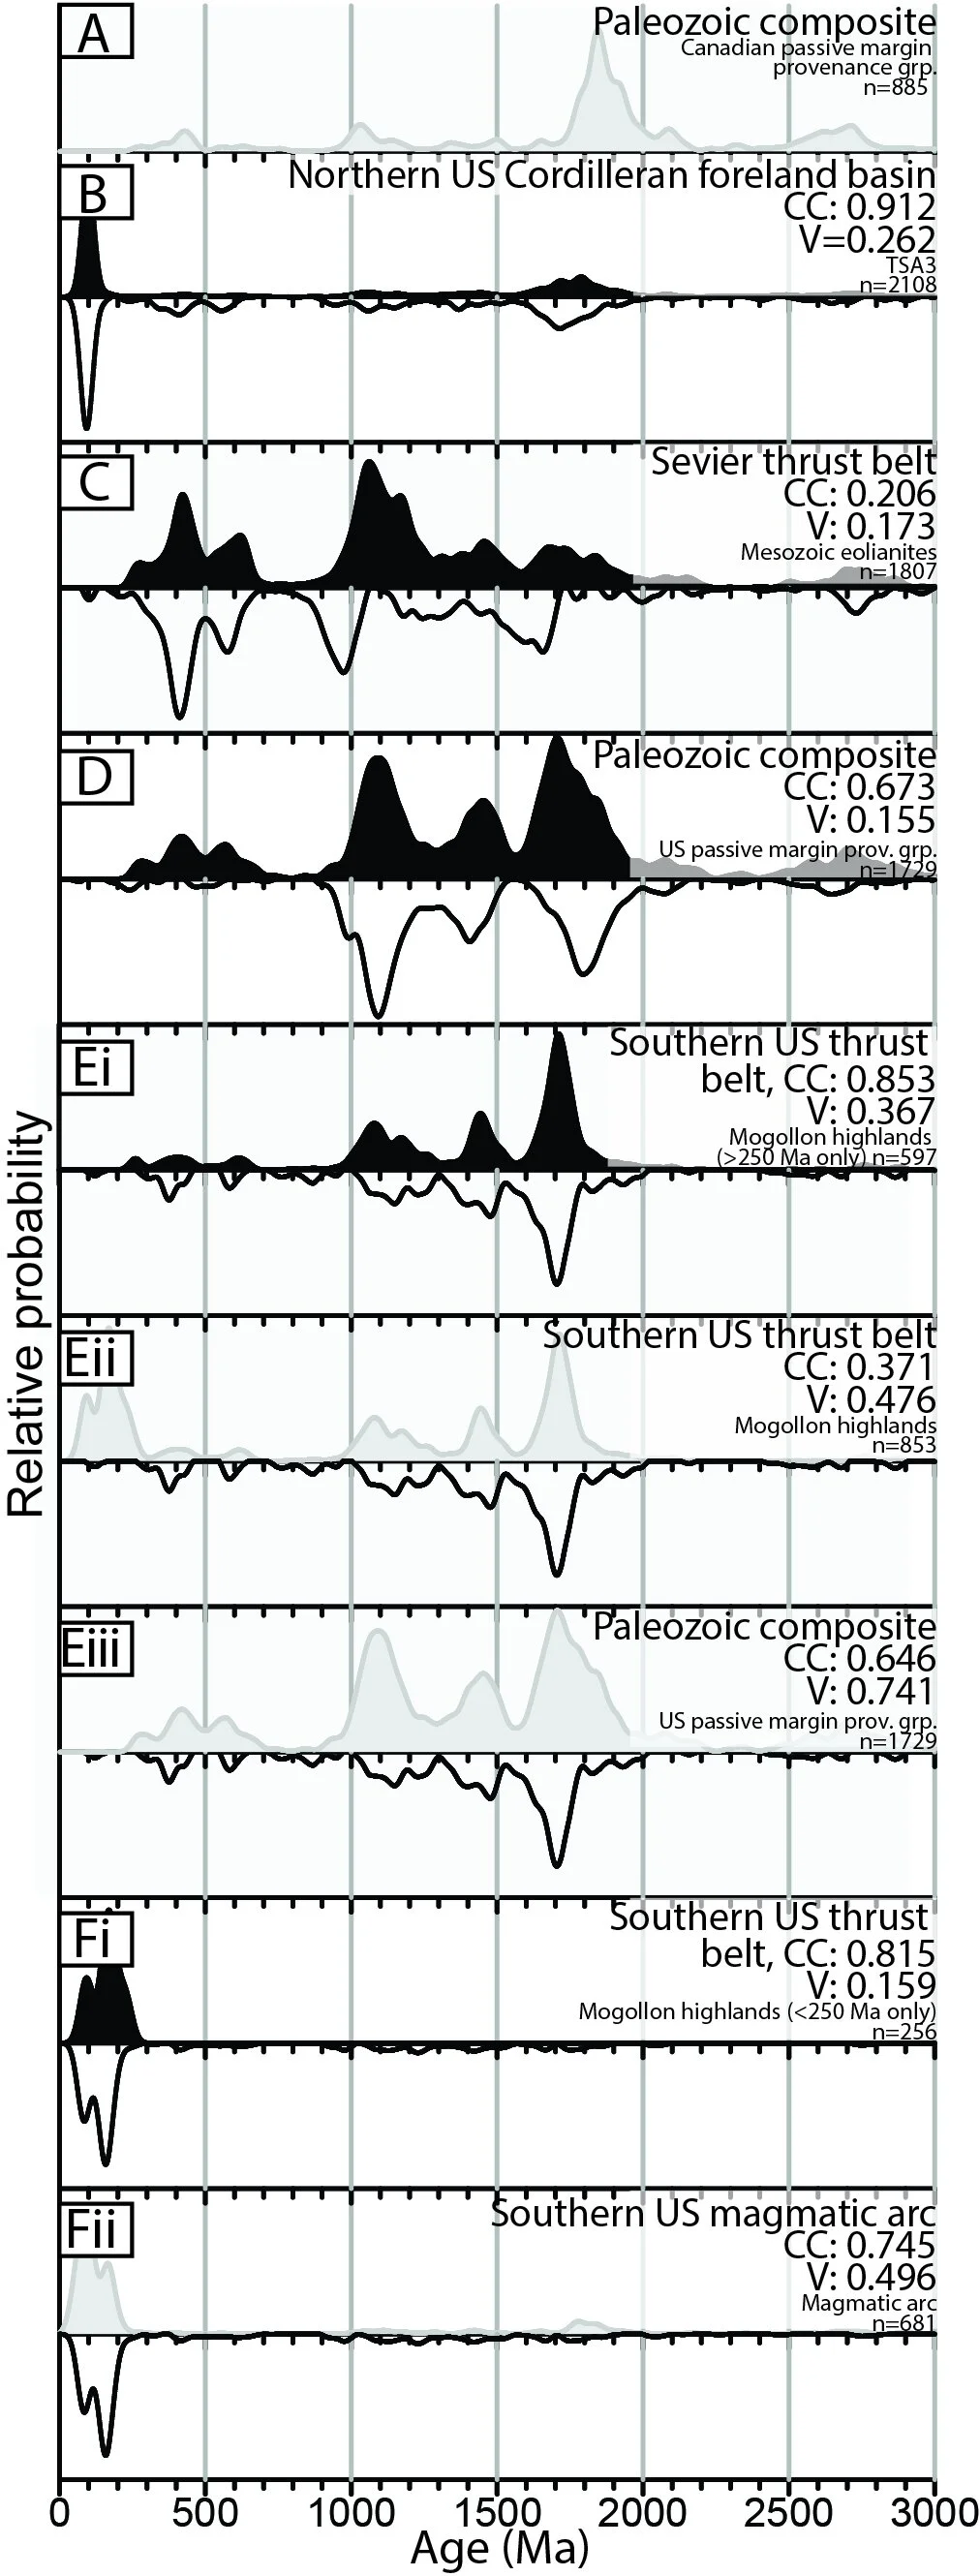
A potential alternative correlation is to Paleozoic strata of the mid-continent basins, specifically the Forrest City Basin (Kissock et al., 2018). These yield closer, but not extremely close correlations (cc = 0.25-0.32).
Nevertheless, assuming that these correlations for source C are accurate, they indicate derivation from thrust-belt sources, which were themselves ultimately derived from the middle or eastern North America.
4. Conclusions
We present a novel inverse method to determine detrital zircon age spectra of source areas without knowledge of those source areas.
We apply segmented linear regression to determine the optimum number of sources for factorization.
The success of these methods is demonstrated by close correlation between known and factorized sources based on a numerically generated data set. It is also shown by close correlation between factorized and potential sources in based on an empirical data set from the Book Cliffs.
Factorization of the Book Cliffs data set yields results very similar to the results of an independent forward model.